Budget & Tax
A look back: 25 years of state spending
May 15, 2018
Curtis Shelton
Note: This originally ran on December 22, 2017. It has been updated with fiscal year 2017 data.
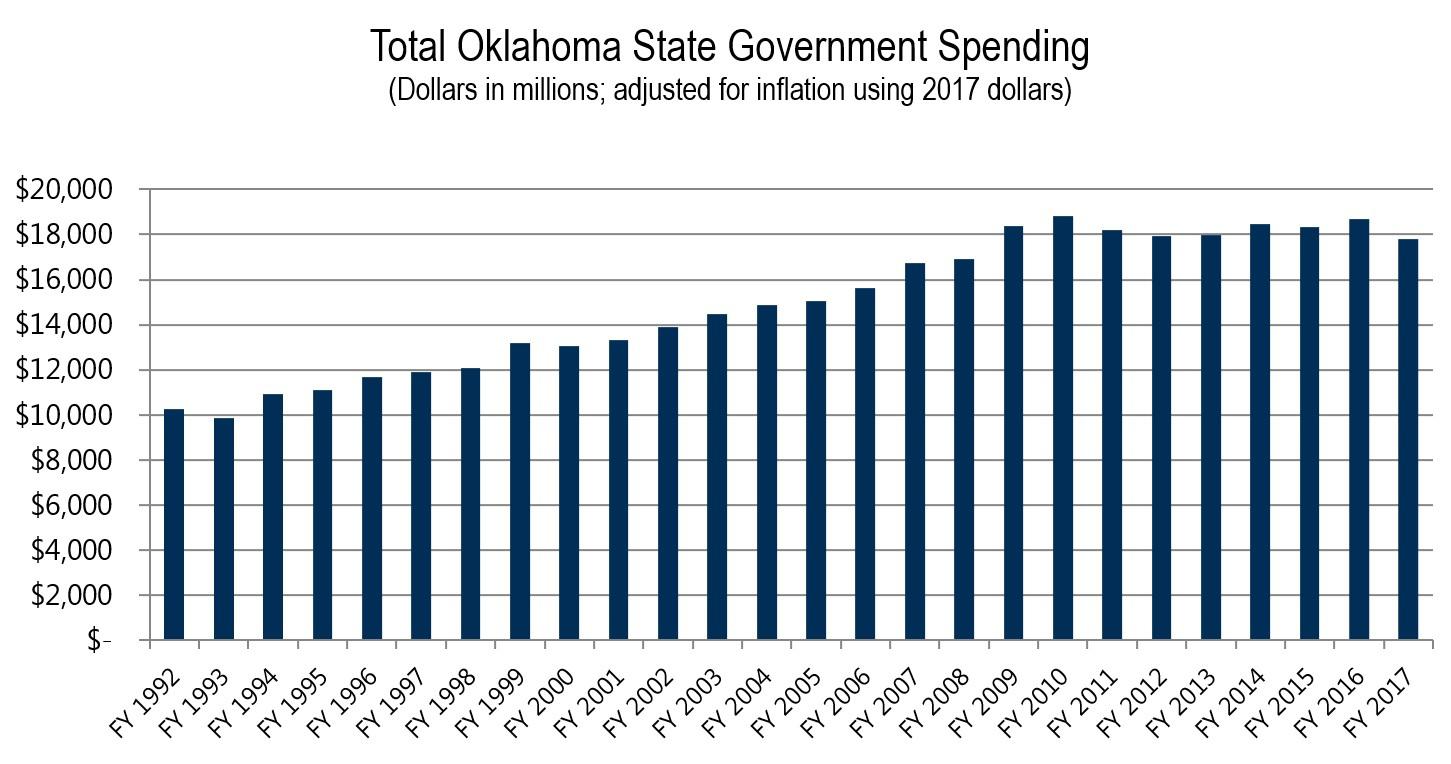
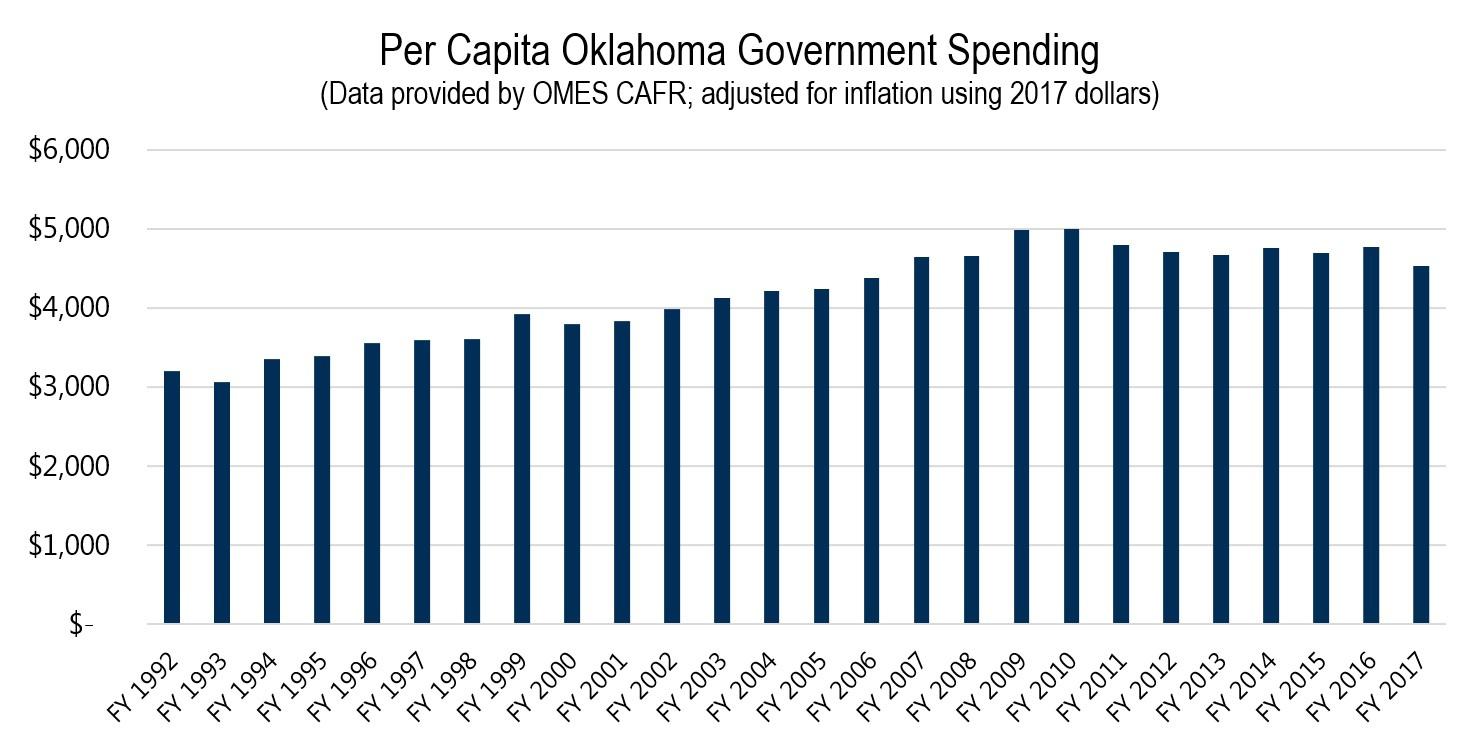
The data analyzed in these charts come from Oklahoma’s Comprehensive Annual Financial Report (CAFR) created by the Office of Management and Enterprise Services (OMES). Because of the long time period (25 years), the numbers are adjusted for inflation. Whether considering the spending totals or spending per person, the long-term trend is an increased cost of state government.

Since 1992, total spending by state government has grown by $7.5 billion. That is an increase of 74%. State spending spiked in 2009 and 2010 due to high oil prices and a massive federal stimulus package. That is important to remember when politicians use 2009 as their base year when complaining about less spending and calling for tax increases.
State spending per capita shows a similar trend of consistent growth followed by a spike and then a flattening out.

Time and again, the term “revenue crisis” has been used to describe the situation surrounding Oklahoma’s budget. Taking a longer view shows that state government spending has grown dramatically over time. In fact, looking from the lowest year (1993) to the highest (2010) shows total state spending grew 89% in that 17-year period. That rate of growth is unsustainable. A better budget conversation would ask where all this increased spending has gone and whether taxpayers are getting a good return for their money.
Sources: