Budget & Tax
Off the charts
December 20, 2017
Curtis Shelton
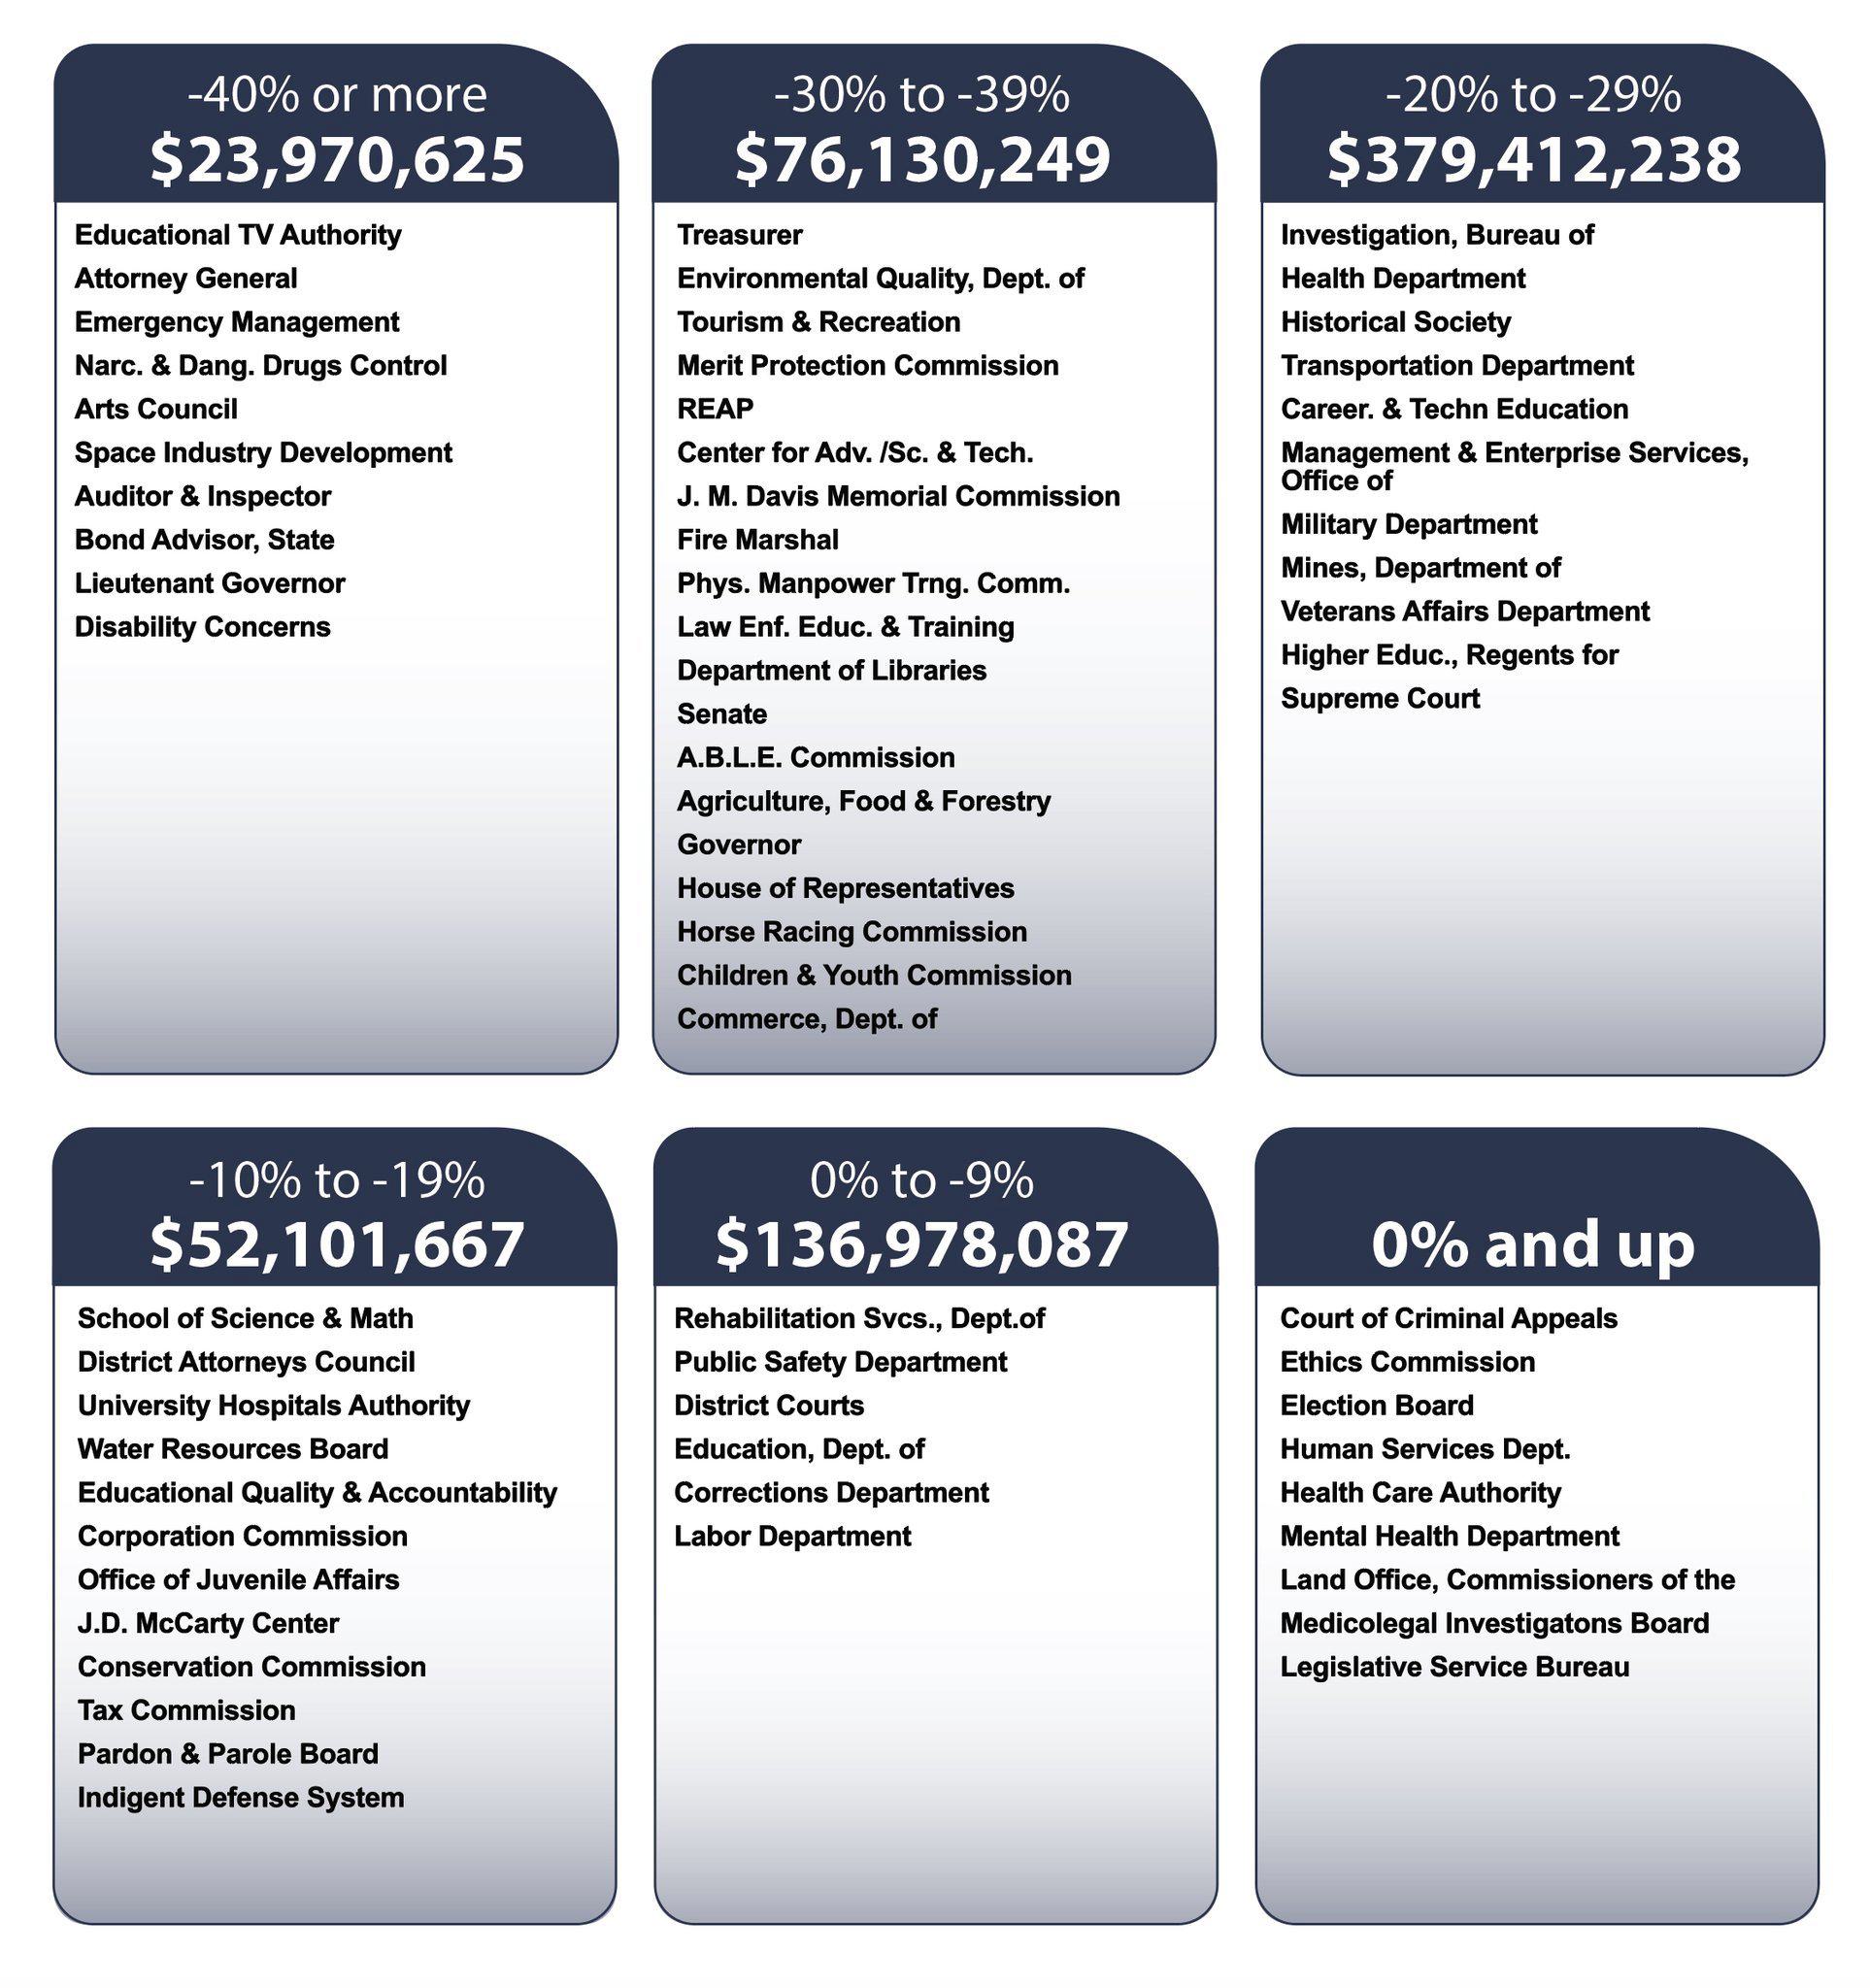
Gov. Mary Fallin, during the regular and first special legislative sessions, repeatedly used a chart showing cuts to state agencies since 2009. This chart is supposed to make the case for increasing taxes to boost state government spending. The Governor's numbers, however, only include appropriations. OCPA has explained numerous times how focusing on appropriations leaves out nearly two-thirds of total state spending.
Gov. Fallin's Chart

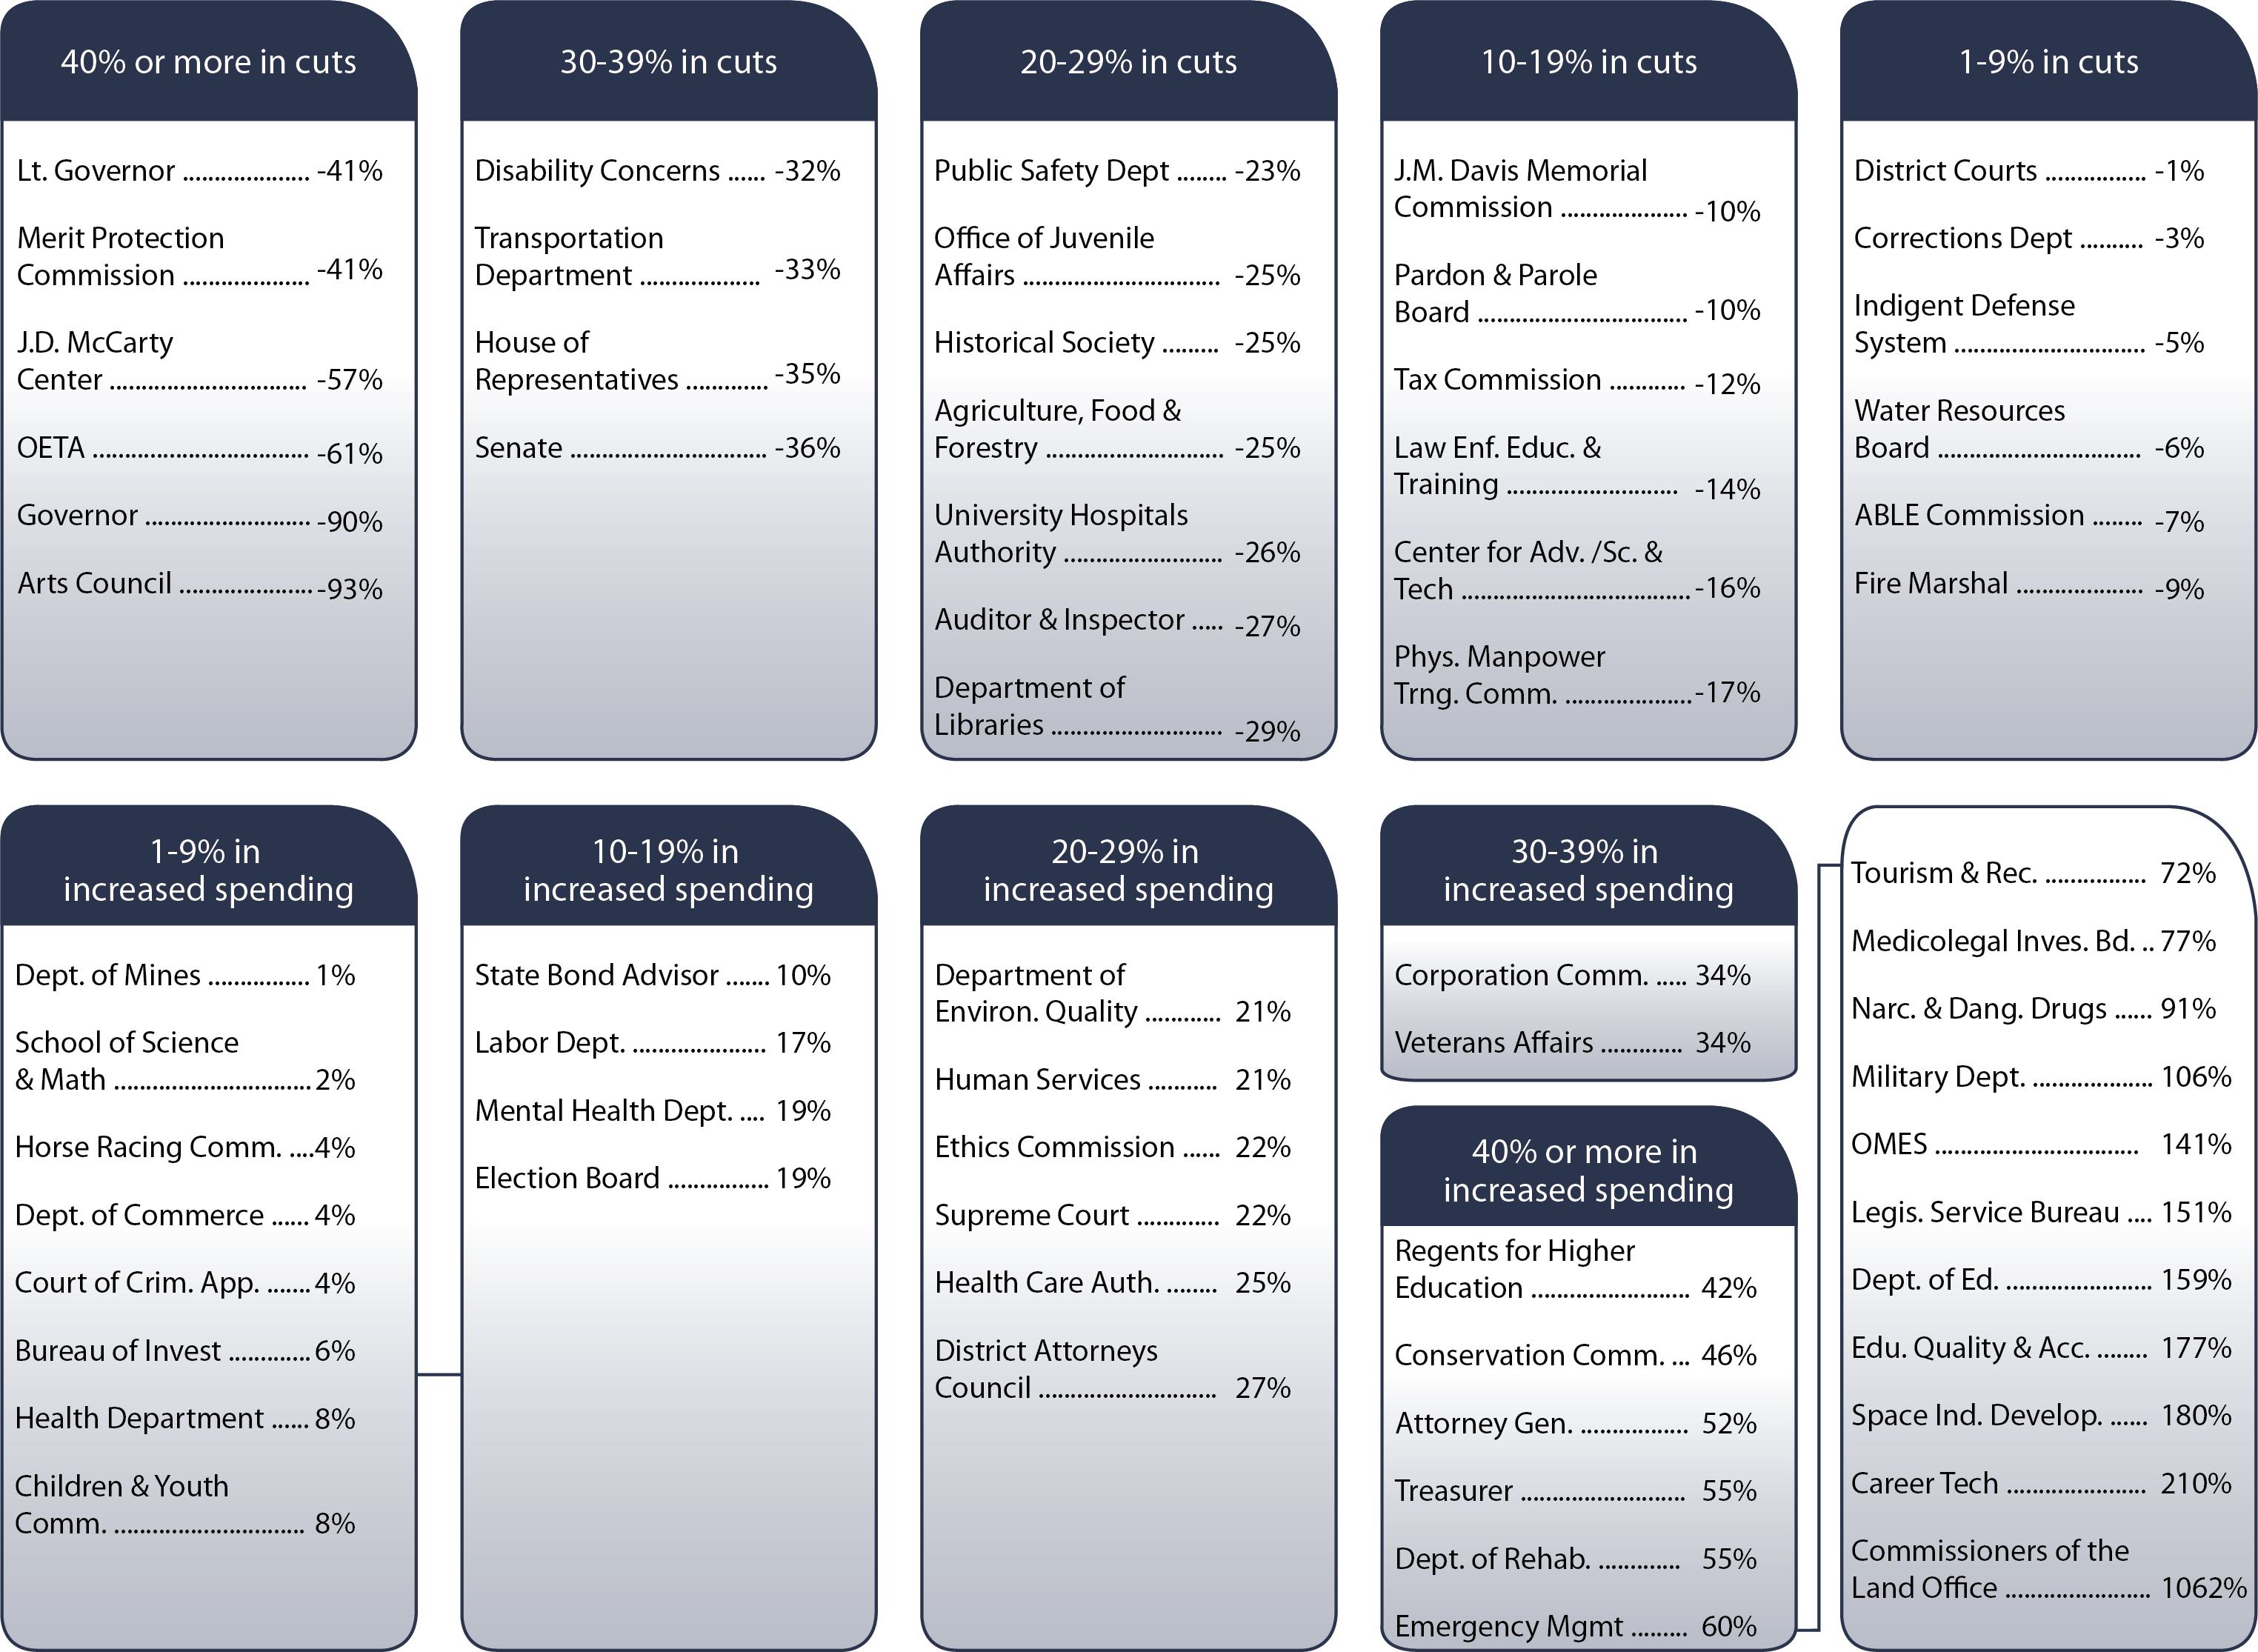
OCPA fact-checked the Governor’s chart and then came up with one of our own. This new chart, below, shows all of the same agencies but is based on changes to total spending and not just spending from legislative appropriations.
The chart used by Gov. Fallin shows 29 agencies have taken cuts of 30% or more. But in terms of total spending, only 10 agencies experienced that large of a cut. What may be most surprising is that 37 of the 66 agencies on the Governor’s list actually increased their total spending since 2009. The Governor’s chart shows only 9 agencies with an increase because it leaves out all spending except appropriations.
OCPA's Chart

Meaningful reforms related to taxing, spending, and budgeting require considering all the money state government receives and spends. Particularly when times are tough, Oklahoma families budget with an eye to all their income and all their spending. Taxpayers deserve an honest budget conversation, one that starts by looking at the whole picture–and looking for ways to increase efficiency and eliminate waste–before taxpayers are asked to give up more.