Budget & Tax
Jonathan Small, J. Scott Moody & Wendy Warcholik, Ph.D. | December 1, 2015
Oklahoma’s shrinking private sector
Jonathan Small, J. Scott Moody & Wendy Warcholik, Ph.D.
When it comes to government spending in Oklahoma, the 800-pound gorilla in the room that many people ignore is this simple question: Should government grow faster than the private sector’s ability to pay?
To answer that question, a little history needs to be explored. There are two major components of government spending in Oklahoma—state and local government worker compensation (SLGWC) and personal current transfer receipts (Social Security, Medicare, Medicaid, and welfare).
Chart 1 illustrates the growth differentials between Oklahoma’s state and local government worker compensation and private-sector income. The data are for calendar years 1929 (the earliest year of available data) to 2014 (the latest year of available data).
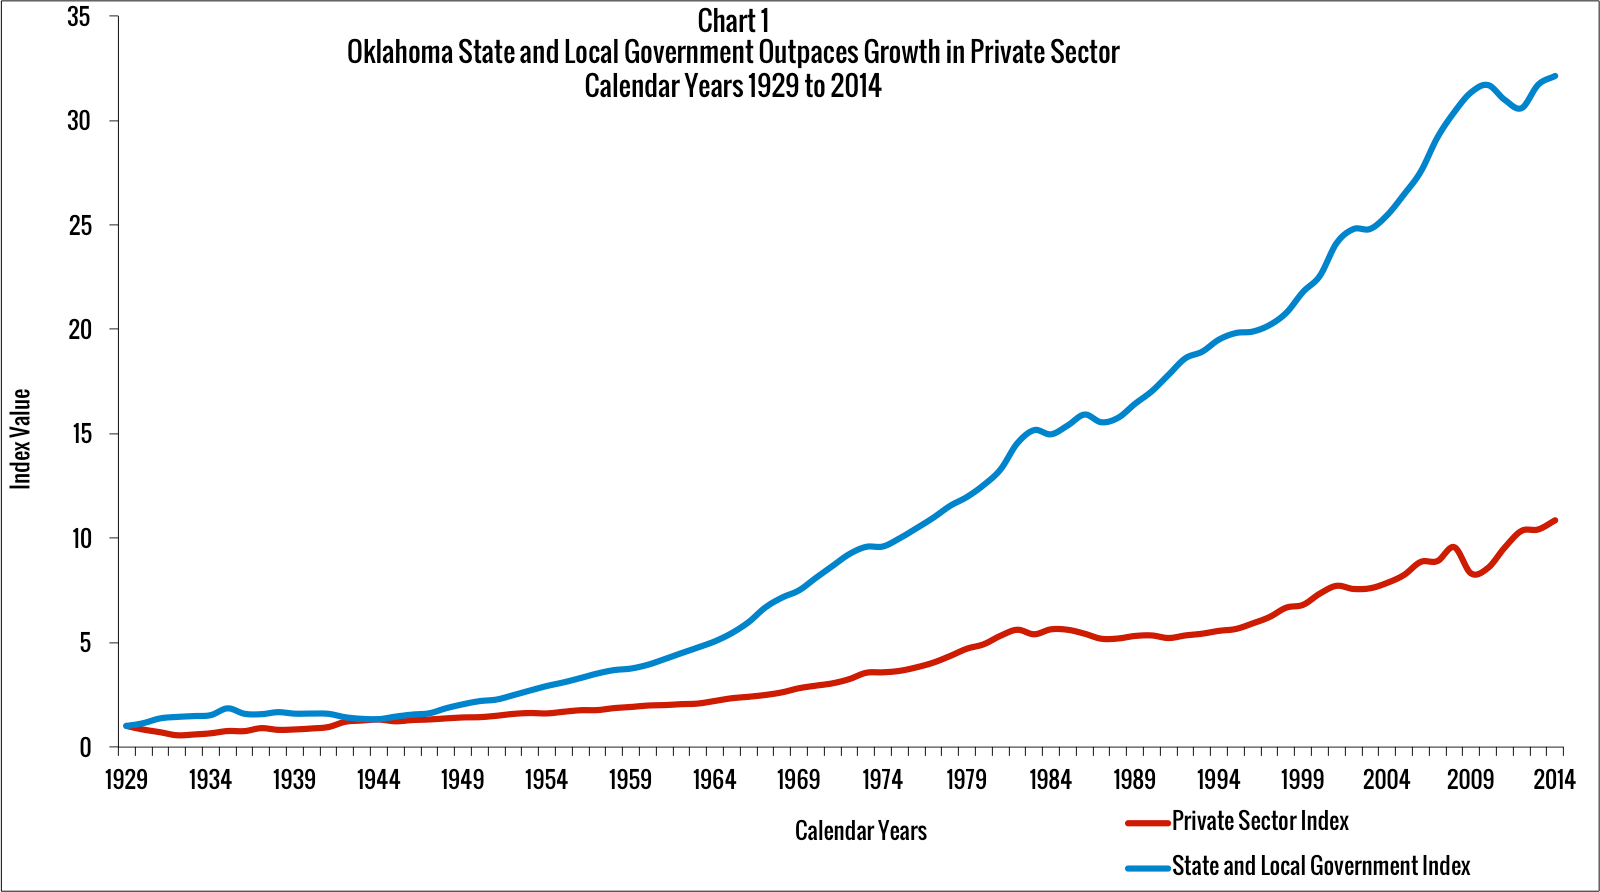
During the Great Depression in the 1930s, SLGWC grew faster than private-sector income, but by 1944 SLGWC and private-sector income were virtually identical.
However, after 1944 the situation is very different as the growth in SLGWC begins to pull away from the growth in Oklahomans’ private-sector income. Between 1944 and 2010, the gap between the two reaches its furthest point.
Since 2010, however, growth in SLGWC has plateaued while the oil and gas boom at the time reinvigorated private-sector growth. Nevertheless, much more needs to be done to close the chasm.
Chart 2 illustrates the growth differentials between personal current transfer receipts (PCTR)—which mostly consist of Social Security, Medicare, Medicaid, and welfare—and private-sector income.
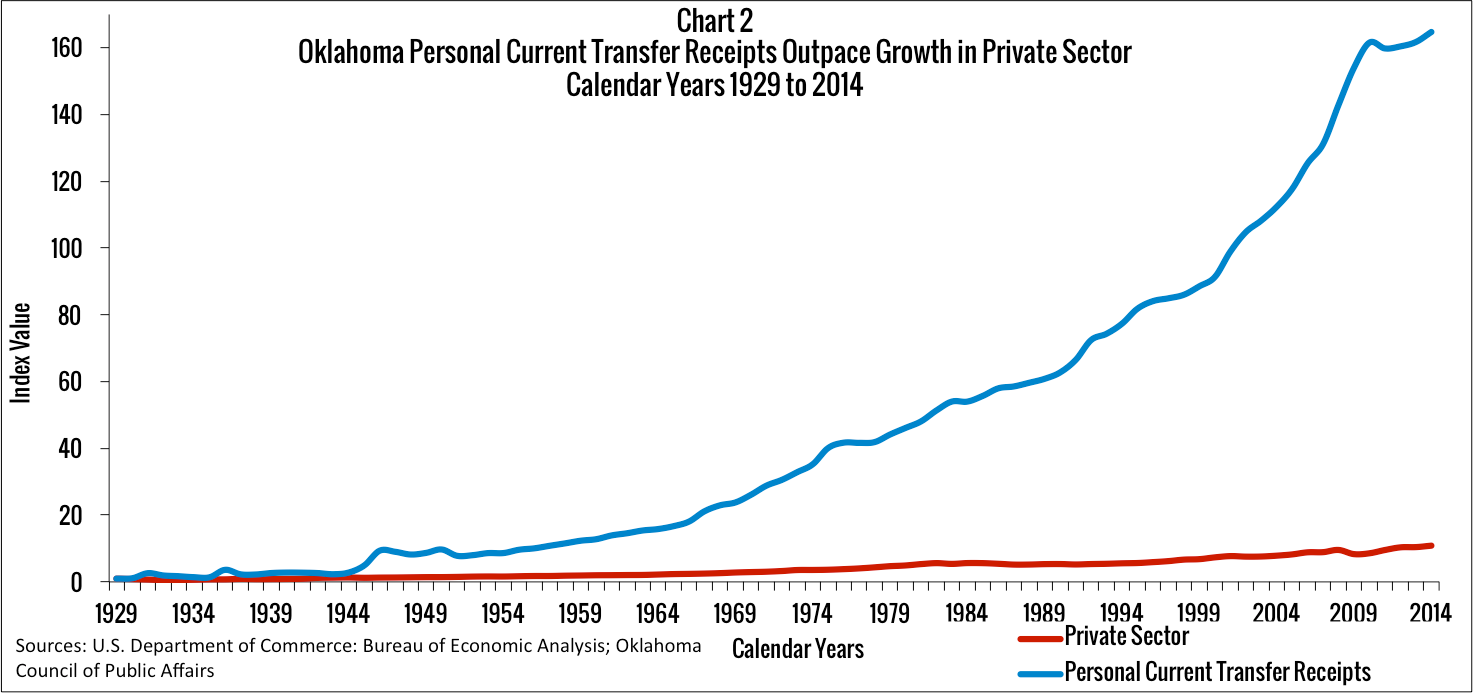
As bad as SLGWC has been, the growth in PCTR has been meteoric in comparison. The growth in PCTR outstripped private-sector income right out of the gate in 1929 and has not looked back. Fortunately, since 2010, growth in PCTR has also plateaued.
What can Oklahoma policymakers do to prevent the further crowd-out of private-sector income? SLGWC is most under the control of state policymakers; both employment levels and compensation levels must be critically examined. At a minimum, a hiring and pay freeze would be welcome relief to the private sector, especially if the savings were invested into a complete overhaul of the income tax system (such as a flat tax) or as a down payment to eliminating the income tax altogether.
However, PCTR is a much bigger problem. Ordinarily, Medicaid reform would help reduce private sector crowd-out, but Obamacare’s maintenance of effort provisions block many sensible state-based reforms.
Finally, policymakers at the state and local levels must refrain from imposing unnecessary regulations on businesses. Such regulations only make it harder for the private sector to do its job—creating new jobs and income.
Oklahoma’s Private Sector Economy by County
Personal income is an important economic measure of a state’s well-being. Higher levels of personal income mean that a state’s residents are able to purchase more goods and services such as homes, cars, education, and health care. Fundamentally, personal income comes from two sources: the private sector and the public sector. The distinction between these two sectors is important because only the private sector creates new income. The public sector can only redistribute income through taxes and spending.
In 2014, Oklahoma’s private-sector share of personal income was 69.4 percent and ranked as the 29th largest in the country. However, the size of the private sector varies greatly by county. As shown in Chart 3 and Table 1, the county with the largest private sector in 2013 (the latest data available at the county level) was Logan County at 81.1 percent. At the other end of the spectrum, Cherokee, Jackson, and Comanche counties had the smallest private sectors at 45.2 percent, 42 percent, and 41.5 percent, respectively.
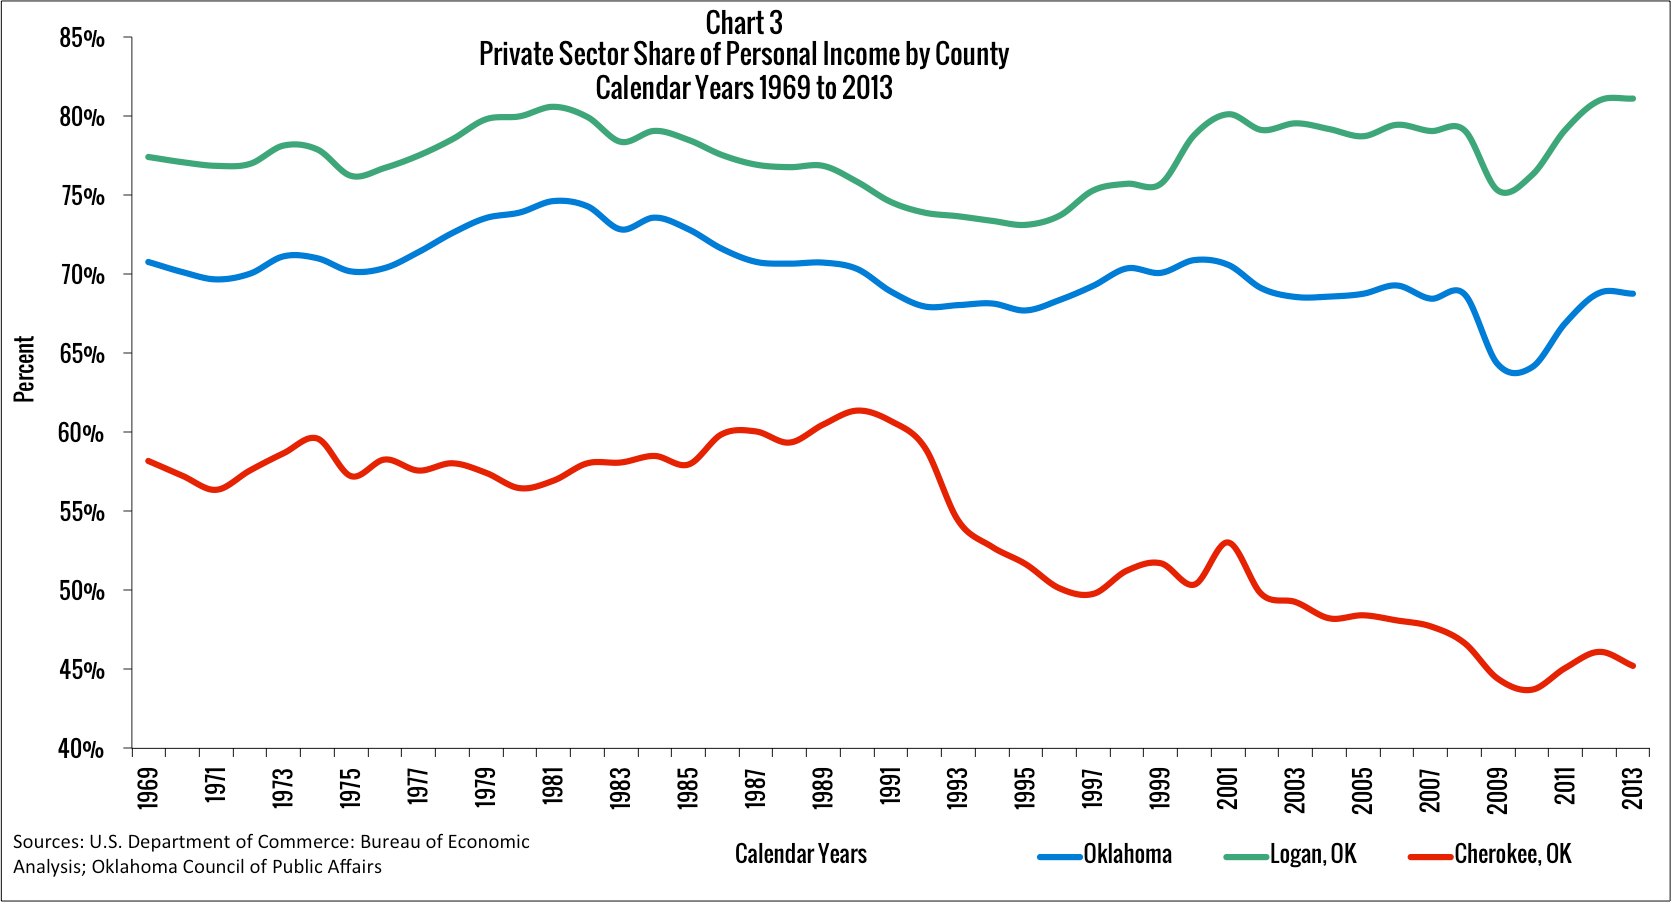
However, a note of caution must be observed when interpreting Comanche and Jackson counties because each hosts a major U.S. military installation—Fort Sill in Comanche County and Altus Air Force Base in Jackson County.
Military installations, generally speaking, are located far from dense population centers. As a result, they tend to dominate the local economy, which creates a distorted economic picture. Nonetheless, military installations are paid for by taxpayers and are not part of the private sector.
If we exclude Comanche and Jackson counties as unique cases, that leaves Cherokee County with the dubious distinction of having Oklahoma’s smallest private sector (45.2 percent), with nearly no military component.
More disturbingly, Cherokee County is joined by 6 additional counties whose private-sector share also falls below 50 percent: Okfuskee (48.7 percent), Ottawa (48.4 percent), Choctaw (47.9 percent), Muskogee (47.2 percent), Love (46.5 percent), and Adair (46 percent).
Over the 1969 to 2013 time period, 13 counties saw increases in their private-sector shares: Washita (52 percent), Comanche (23 percent), Latimer (19 percent), Dewey (9 percent), Pittsburg (8 percent), Beckham (8 percent), Ellis (6 percent), Woodward (5 percent), Oklahoma (5 percent), Logan (5 percent), Johnston (4 percent), Custer (2 percent), and Canadian (2 percent). The remaining counties mirrored the state average with declining private-sector shares. The steepest drop belongs to Ottawa County, falling 36 percent—to 48.4 percent in 2013 from 76.1 percent in 1969.
The Private-Sector Battle: Oklahoma vs. Texas
In terms of sheer economic size, there is no more important neighbor to Oklahoma than Texas. So it is a very useful exercise to compare and contrast the two states to see what Oklahoma policymakers can learn. Of course, it is well known that, unlike Oklahoma, Texas does not levy a broad-based individual or corporate income tax (though Texas does levy a gross receipts tax on certain industries). Has the absence of an income tax made a difference in the course of the Texas economy? The answer is a resounding yes.
Chart 4 shows the growth difference between Oklahoma and Texas for two key measures: the private-sector share of personal income and real, per-household personal income. In this analysis, the private-sector share of personal income (hereafter “private sector income”) is defined as total personal income minus personal current transfer receipts (Social Security, Medicare, Medicaid, and welfare) and government compensation (federal, state, and local).
Chart 4 shows that in the years of the Great Depression and World War II, Oklahoma and Texas had very similar private-sector shares of personal income. Relatedly, real, per-household personal incomes were also at similar levels.
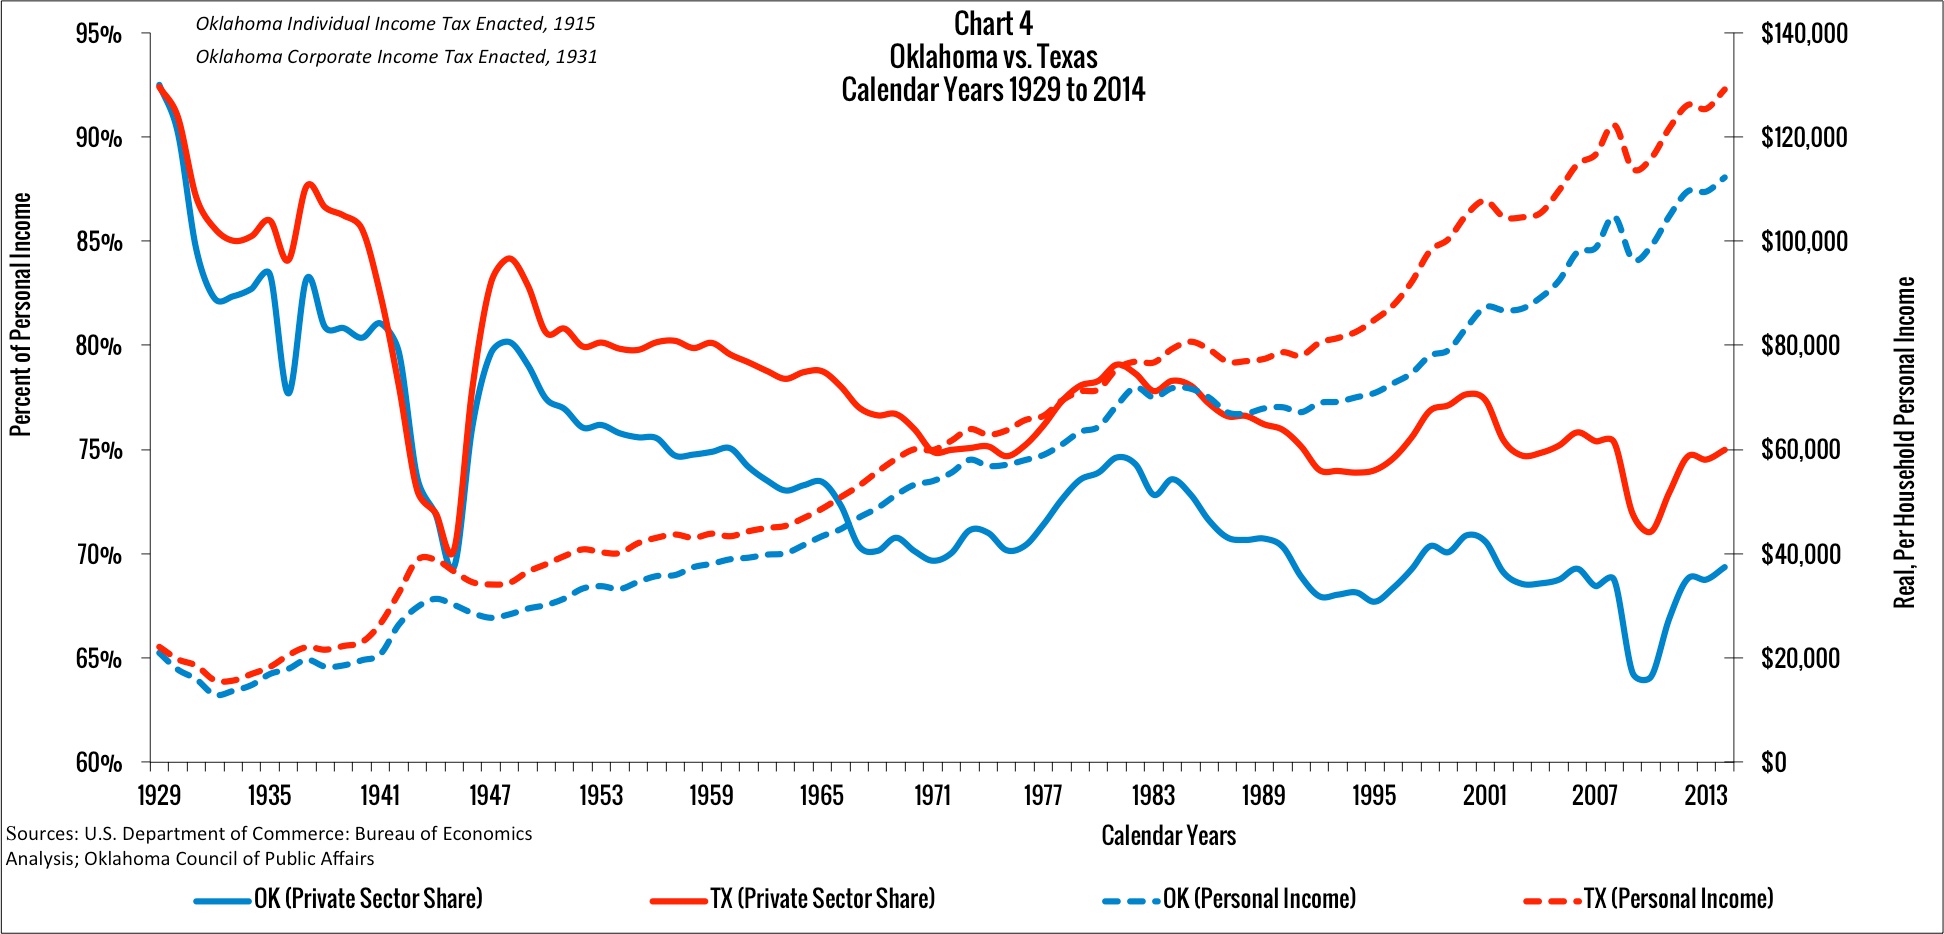
However, at the same time, Oklahoma embarked on a very different policy path from the one chosen in Texas. Oklahoma enacted the individual income tax in 1915 and the corporate income tax in 1931. The additional revenue from these taxes fueled the expansion of government spending and, consequently, the crowd-out of the private sector after World War II.
The gap in the private sector between Oklahoma and Texas has only grown wider since then. By 2014, Oklahoma had only the 29th largest private sector in the country (69.4 percent) while Texas had the 7th largest private sector (75 percent). As a result, Oklahoma had the 25th highest per-household personal income ($112,233) while Texas had the 13th highest per-household personal income ($129,113).
The difference in private sectors can’t be attributed to any one component. In 2014, personal current transfer receipts, as a percent of personal income, were 18.9 percent lower in Texas than Oklahoma (14.5 percent vs. 17.8 percent, respectively). The same situation exists for government compensation, which is 17.6 percent lower in Texas than in Oklahoma (10.5 percent vs. 12.8 percent).
Overall, Oklahoma’s policymakers have failed their constituents by not paying enough attention to the economic success story that exists just south of the Red River. Consequently, Oklahoma families have less income with which to raise their children and pursue their dreams.
The path forward is clear. Oklahoma must reduce the size of government and use the savings to eliminate Oklahoma’s income tax system. This will put the state back on the path to parity with Texas.
Oklahoma’s Private-Sector Rebound?
Chart 5 shows that, nationally, private-sector income has shrunk to its lowest levels ever. In fact, during the “Great Recession,” private-sector income hit an all-time low of 67.7 percent in 2010. Over the entire 1929 to 2014 time period, private-sector income has fallen by nearly 24 percent—to 70.7 percent in 2014 from 92.4 percent in 1929.
Additionally, Chart 5 shows that Oklahoma’s private-sector income and, consequently, per-household personal income have trailed the national average for nearly the entire time period, despite starting above the national average in 1929. Since then, only on one occasion (during the oil boom between 1981 and 1982) did private-sector income and per-household personal income exceed the national average.
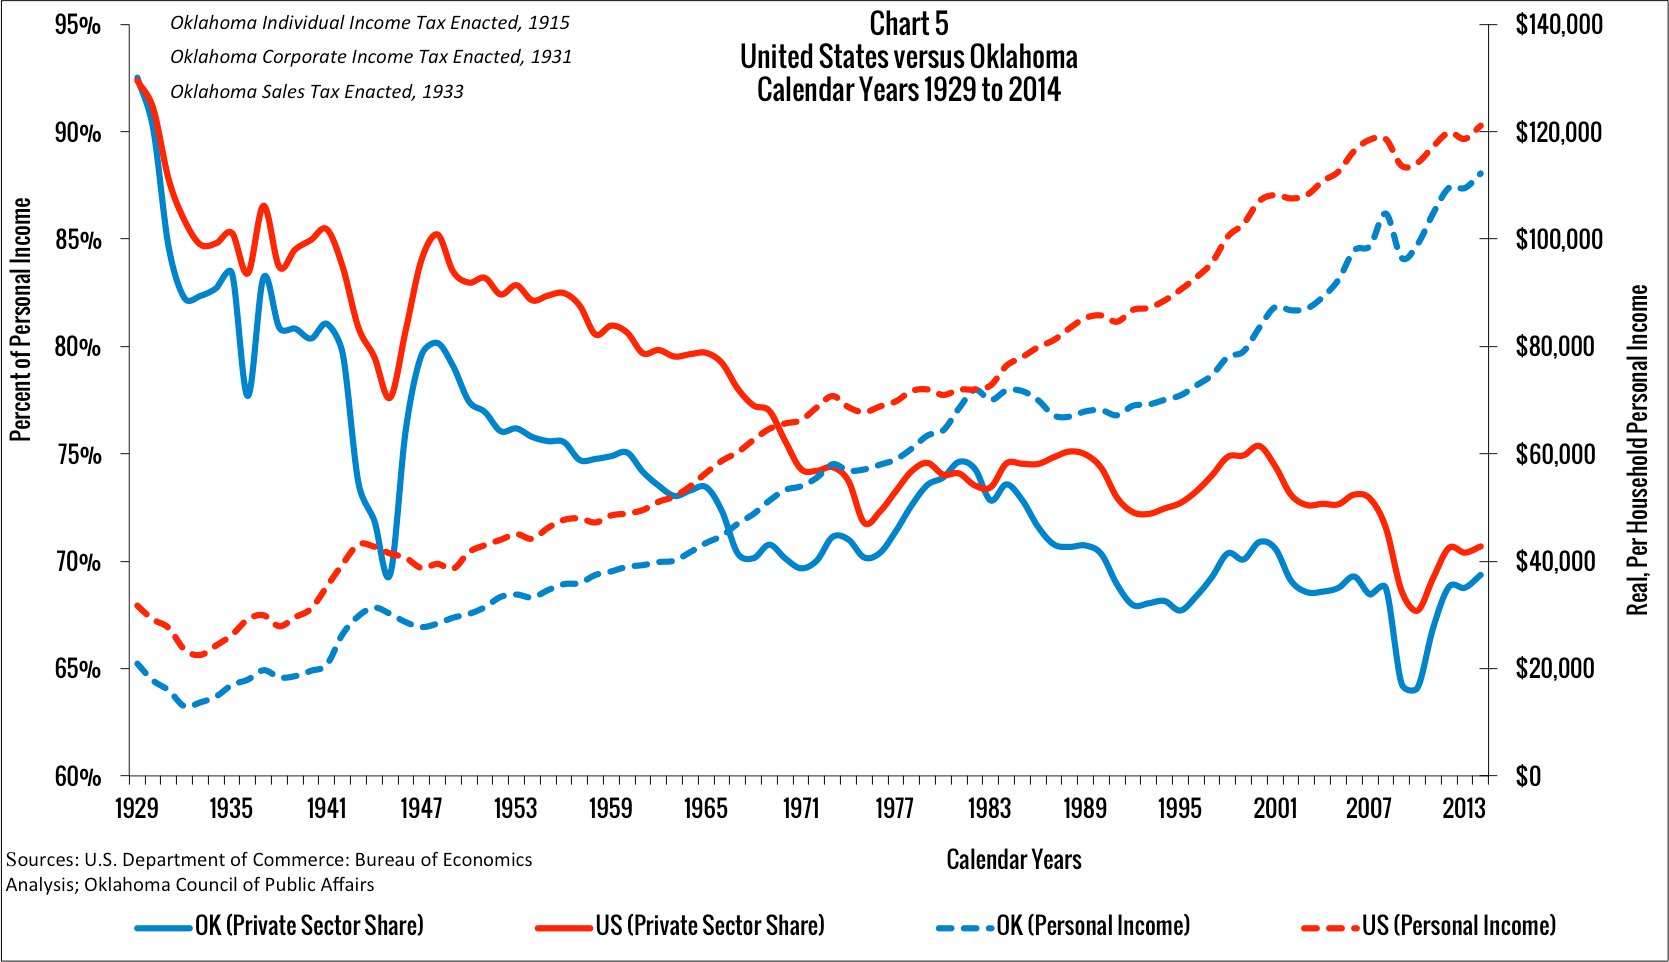
Fortunately, Oklahoma has recently seen another oil and gas boom, thanks in part to the new technique of hydraulic fracturing, and private-sector income has nearly reached parity with the national average. Per-household personal income is also getting closer to parity with the national average.
Relative to the other 49 states, Oklahoma has generally been ranked in the bottom third of states. In 2010, Oklahoma had only the 38th largest private sector in the country with a private sector share of 64.1 percent.
Thankfully, the recent oil and gas boom has boosted the private sector share to 69.4 percent and moved Oklahoma up 11 spots to the 29th largest in 2014. But given the sharp declines in oil and gas commodity prices in 2015, and the resultant retraction in private-sector activity in Oklahoma, bold leadership is needed in Oklahoma.
Chart 6 illustrates why Oklahoma’s policymakers should be very concerned. This chart illustrates the positive correlation between per capita personal income and the private-sector share of personal income. In other words, the bigger the private-sector share, the bigger the per capita personal income. This should come as no surprise since the private sector is the proverbial “goose that lays the golden eggs.”
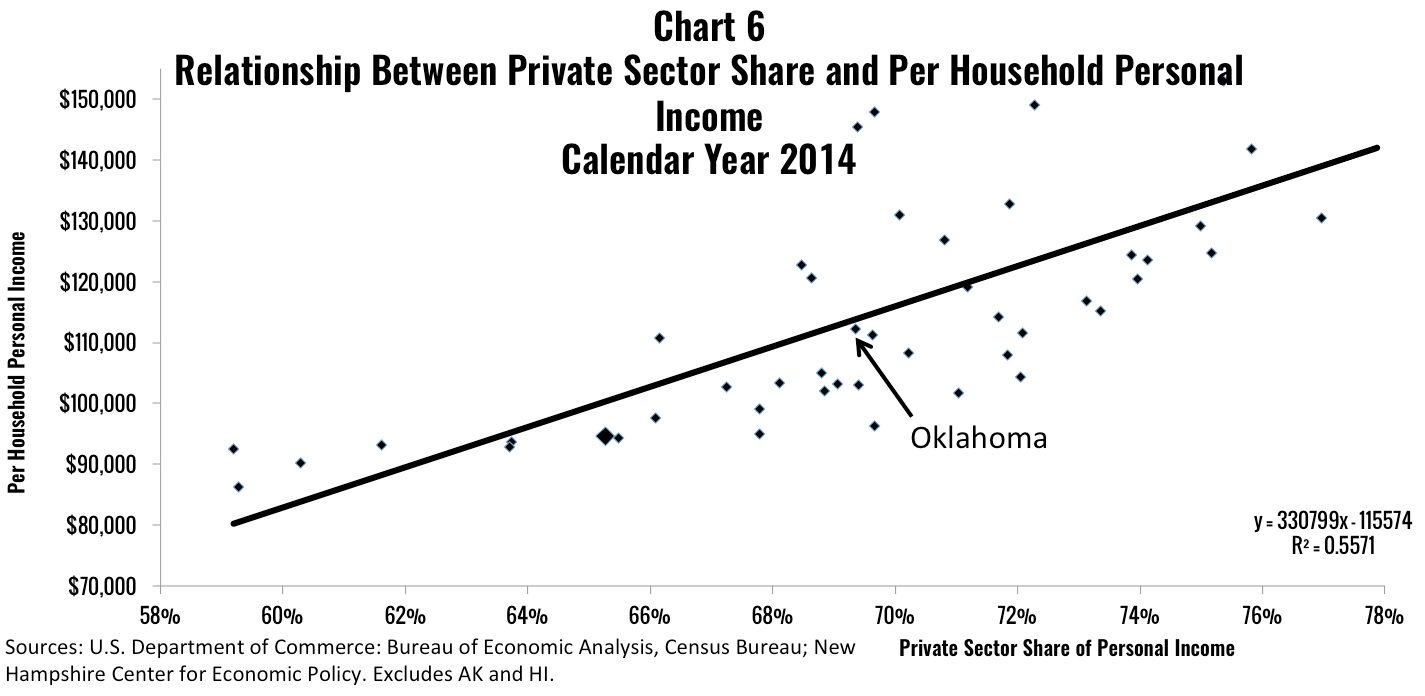
States with larger private sectors will grow faster over time than states with smaller private sectors. For instance, the state with the largest private-sector share (Connecticut, 77.9 percent) has per-household personal income of $166,790. The state with the smallest private-sector share (New Mexico, 59.2 percent) has a per-household personal income of $92,488. To put it another way, Connecticut’s per capita personal income is 80 percent larger than New Mexico’s.
Overall, our analysis shows the alarming trend that, nationally and in Oklahoma, the composition of personal income has significantly shifted away from the private sector and toward the public sector. More disturbingly, the long-term trend line points toward an ever smaller private-sector share of personal income, especially with the aging of America and consequent rise in entitlement spending.
Unfortunately, there will be an economic price paid as the private-sector share continues to shrink. The transfer of resources from the private sector to the public sector, via taxes and/or regulations, will stifle future entrepreneurial growth. Since only the private sector can create new income, the future may well bring a declining standard of living.
However, the future is not written in stone. Oklahoma’s own entrepreneurial spirit has helped to reinvent the state’s economy many times over the years. Proper public policy that embraces secure property rights, low taxes, and fewer regulations will lead to an environment where entrepreneurship can thrive. Business and policy leaders must work together to ensure that the entrepreneurial spirit lives on so that Oklahomans can rely on the private sector, not the public sector, for their livelihood. If we truly care about empowering the most vulnerable Oklahomans, we will work to build a strong and diverse economy. This provides the best opportunity for all to achieve their full potential.

Jonathan Small
President
J. Scott Moody
OCPA Research Fellow
Wendy Warcholik, Ph.D.
OCPA Research Fellow