
Budget & Tax
For wealth migration, overall tax burden matters
Curtis Shelton | July 24, 2019
In a recent article I looked at a Bloomberg analysis of net wealth migration and explored the relationship between the income tax and where people choose to live. The analysis shows that the states which have gained the most AGI from interstate migration usually have lower income tax rates than those with high income taxes. The Bloomberg analysis only showed data for one year (2016), but How Money Walks has been looking at this trend since 1992 and has found similar results: more wealth was moving from high income-tax states to low income-tax states.
Nonetheless, there are some states that do not follow this pattern, such as Oregon and Illinois. Oregon has seen a large gain in net adjusted growth income (AGI) migration despite having one of the highest income taxes in the country. There may be a few reasons for this. First, Oregon is located right next to California, which has boasted the highest income tax rate in the country since 2013. According to IRS data compiled by How Money Walks, Oregon has gained over $8.33 billion in annual AGI from California alone. This is 78 percent of Oregon’s total net gain since 1992. Second, Oregon has a relatively low per capita tax burden, $2,593, that ranks as the 21st lowest tax burden in the country. Compare that to California’s $4,016 per capita tax burden and you can see why Californians have opted to move north.
Illinois has seen the inverse of Oregon’s experience. While it has a relatively low income tax rate compared to the rest of the country, its overall tax burden has had to keep pace with its ever-expanding government. Illinois has a tax burden of $2,993 per capita that places it 31st in terms of per capita tax burden.
While the income tax rate may be a good indicator of a state’s potential for growth, a state’s overall tax burden is also an important metric to consider when assessing a state’s financial competitiveness. Again, looking at Bloomberg’s top 10 winners and losers in net AGI migration, states with a lower overall tax burden outgained those states with a higher tax burden.
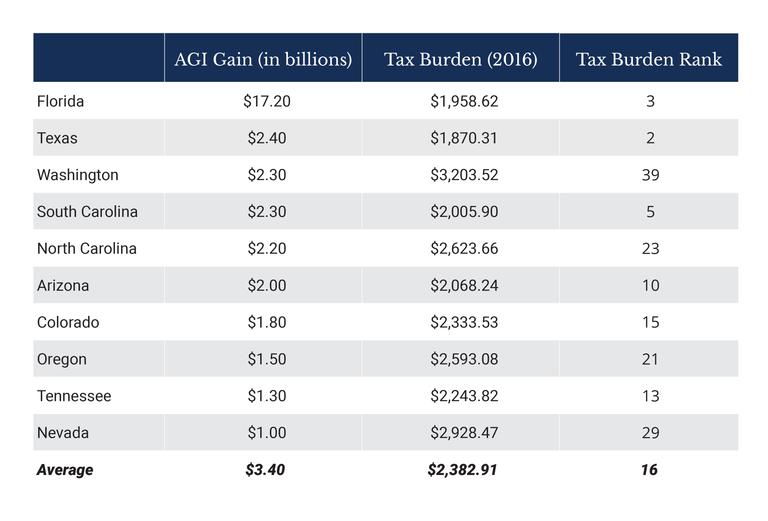
Source: U.S. Census Bureau Quarterly Summaries; U.S. Census Bureau
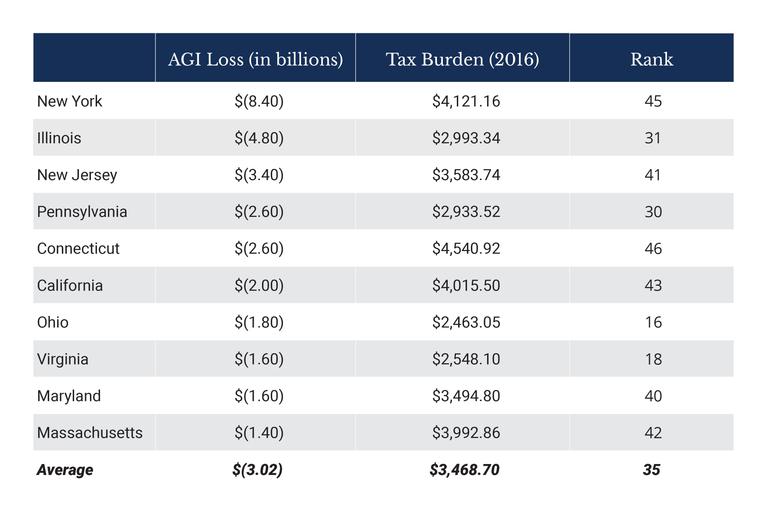
Source: U.S. Census Bureau Quarterly Summaries; U.S. Census Bureau
The average overall tax burden of the top 10 gainers was $2,383, while the average of the top 10 losers was $3,469, a $1,086 difference. Four of the top 10 gainers were in the lowest 10 tax burdens in the country while the six of the top 10 losers were in the top 10 highest overall tax burdens.

Curtis Shelton
Policy Director
Curtis Shelton currently serves as the policy director for OCPA with a focus on fiscal policy. Curtis graduated Oklahoma State University in 2016 with a Bachelors of Arts in Finance. Previously, he served as a summer intern at OCPA and spent time as a staff accountant for Sutherland Global Services.